When working locally, you’ll also want to install the Live Server plugin, for quick/auto reloading in the browser!
For dev work, Chrome is the best browser in town. (They are all kind of differently bad, in different ways.)
Chrome DevTools
We’ll be using Chrome’s developer tools.
Chrome has the most robust, best-in-class set of DevTools—though Safari and Firefox have their own versions, too. You’ll often hear people (Michael) call it the “Web Inspector” or just “The Inspector”. It’s going to be your best (Web) friend, showing you everything that the browser has parsed to display the page.
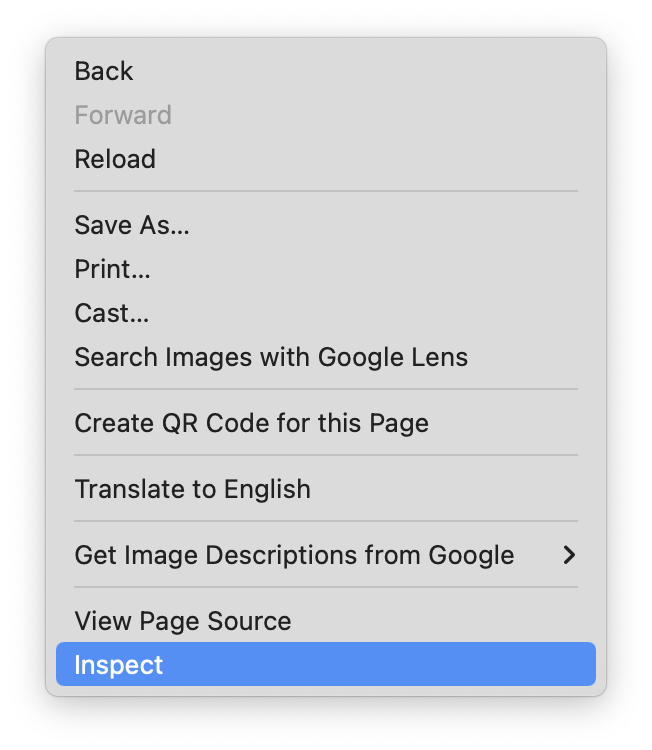
In Chrome, you can bring them up by right-clicking on any element/part of a page and clicking Inspect.
You can also hit ⌘ ⌥ I (command-option-I), on the Mac.
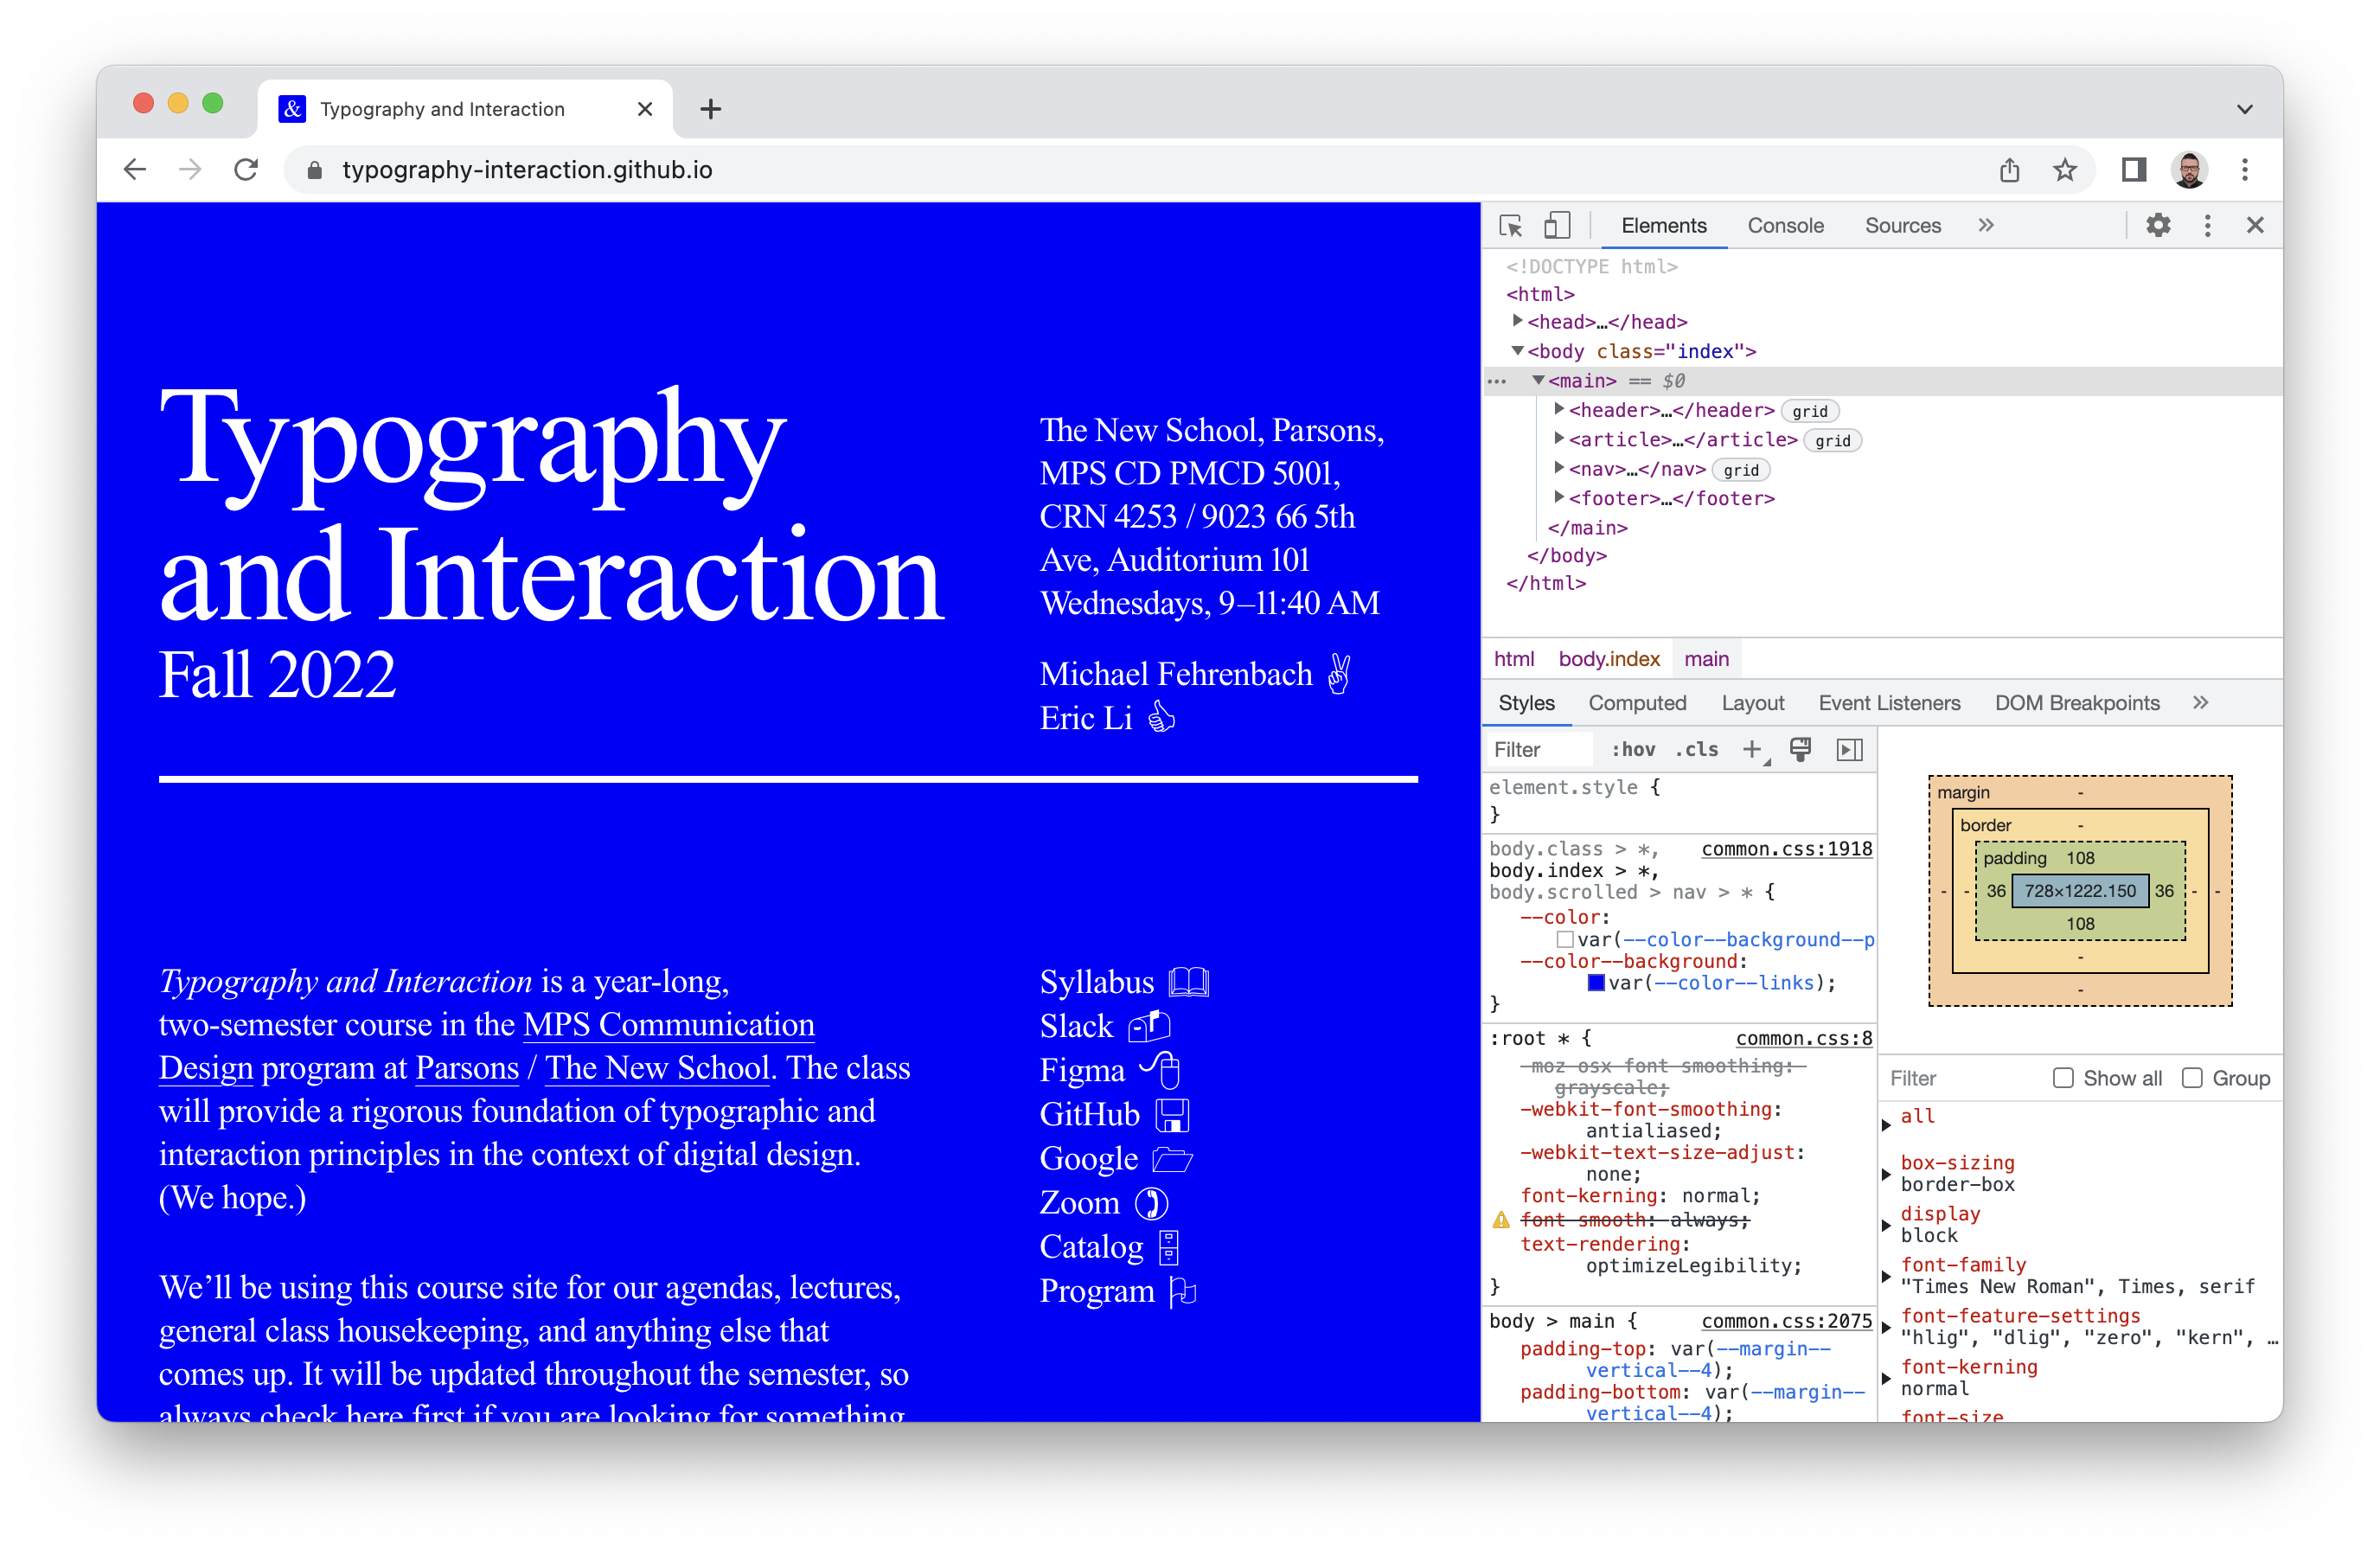
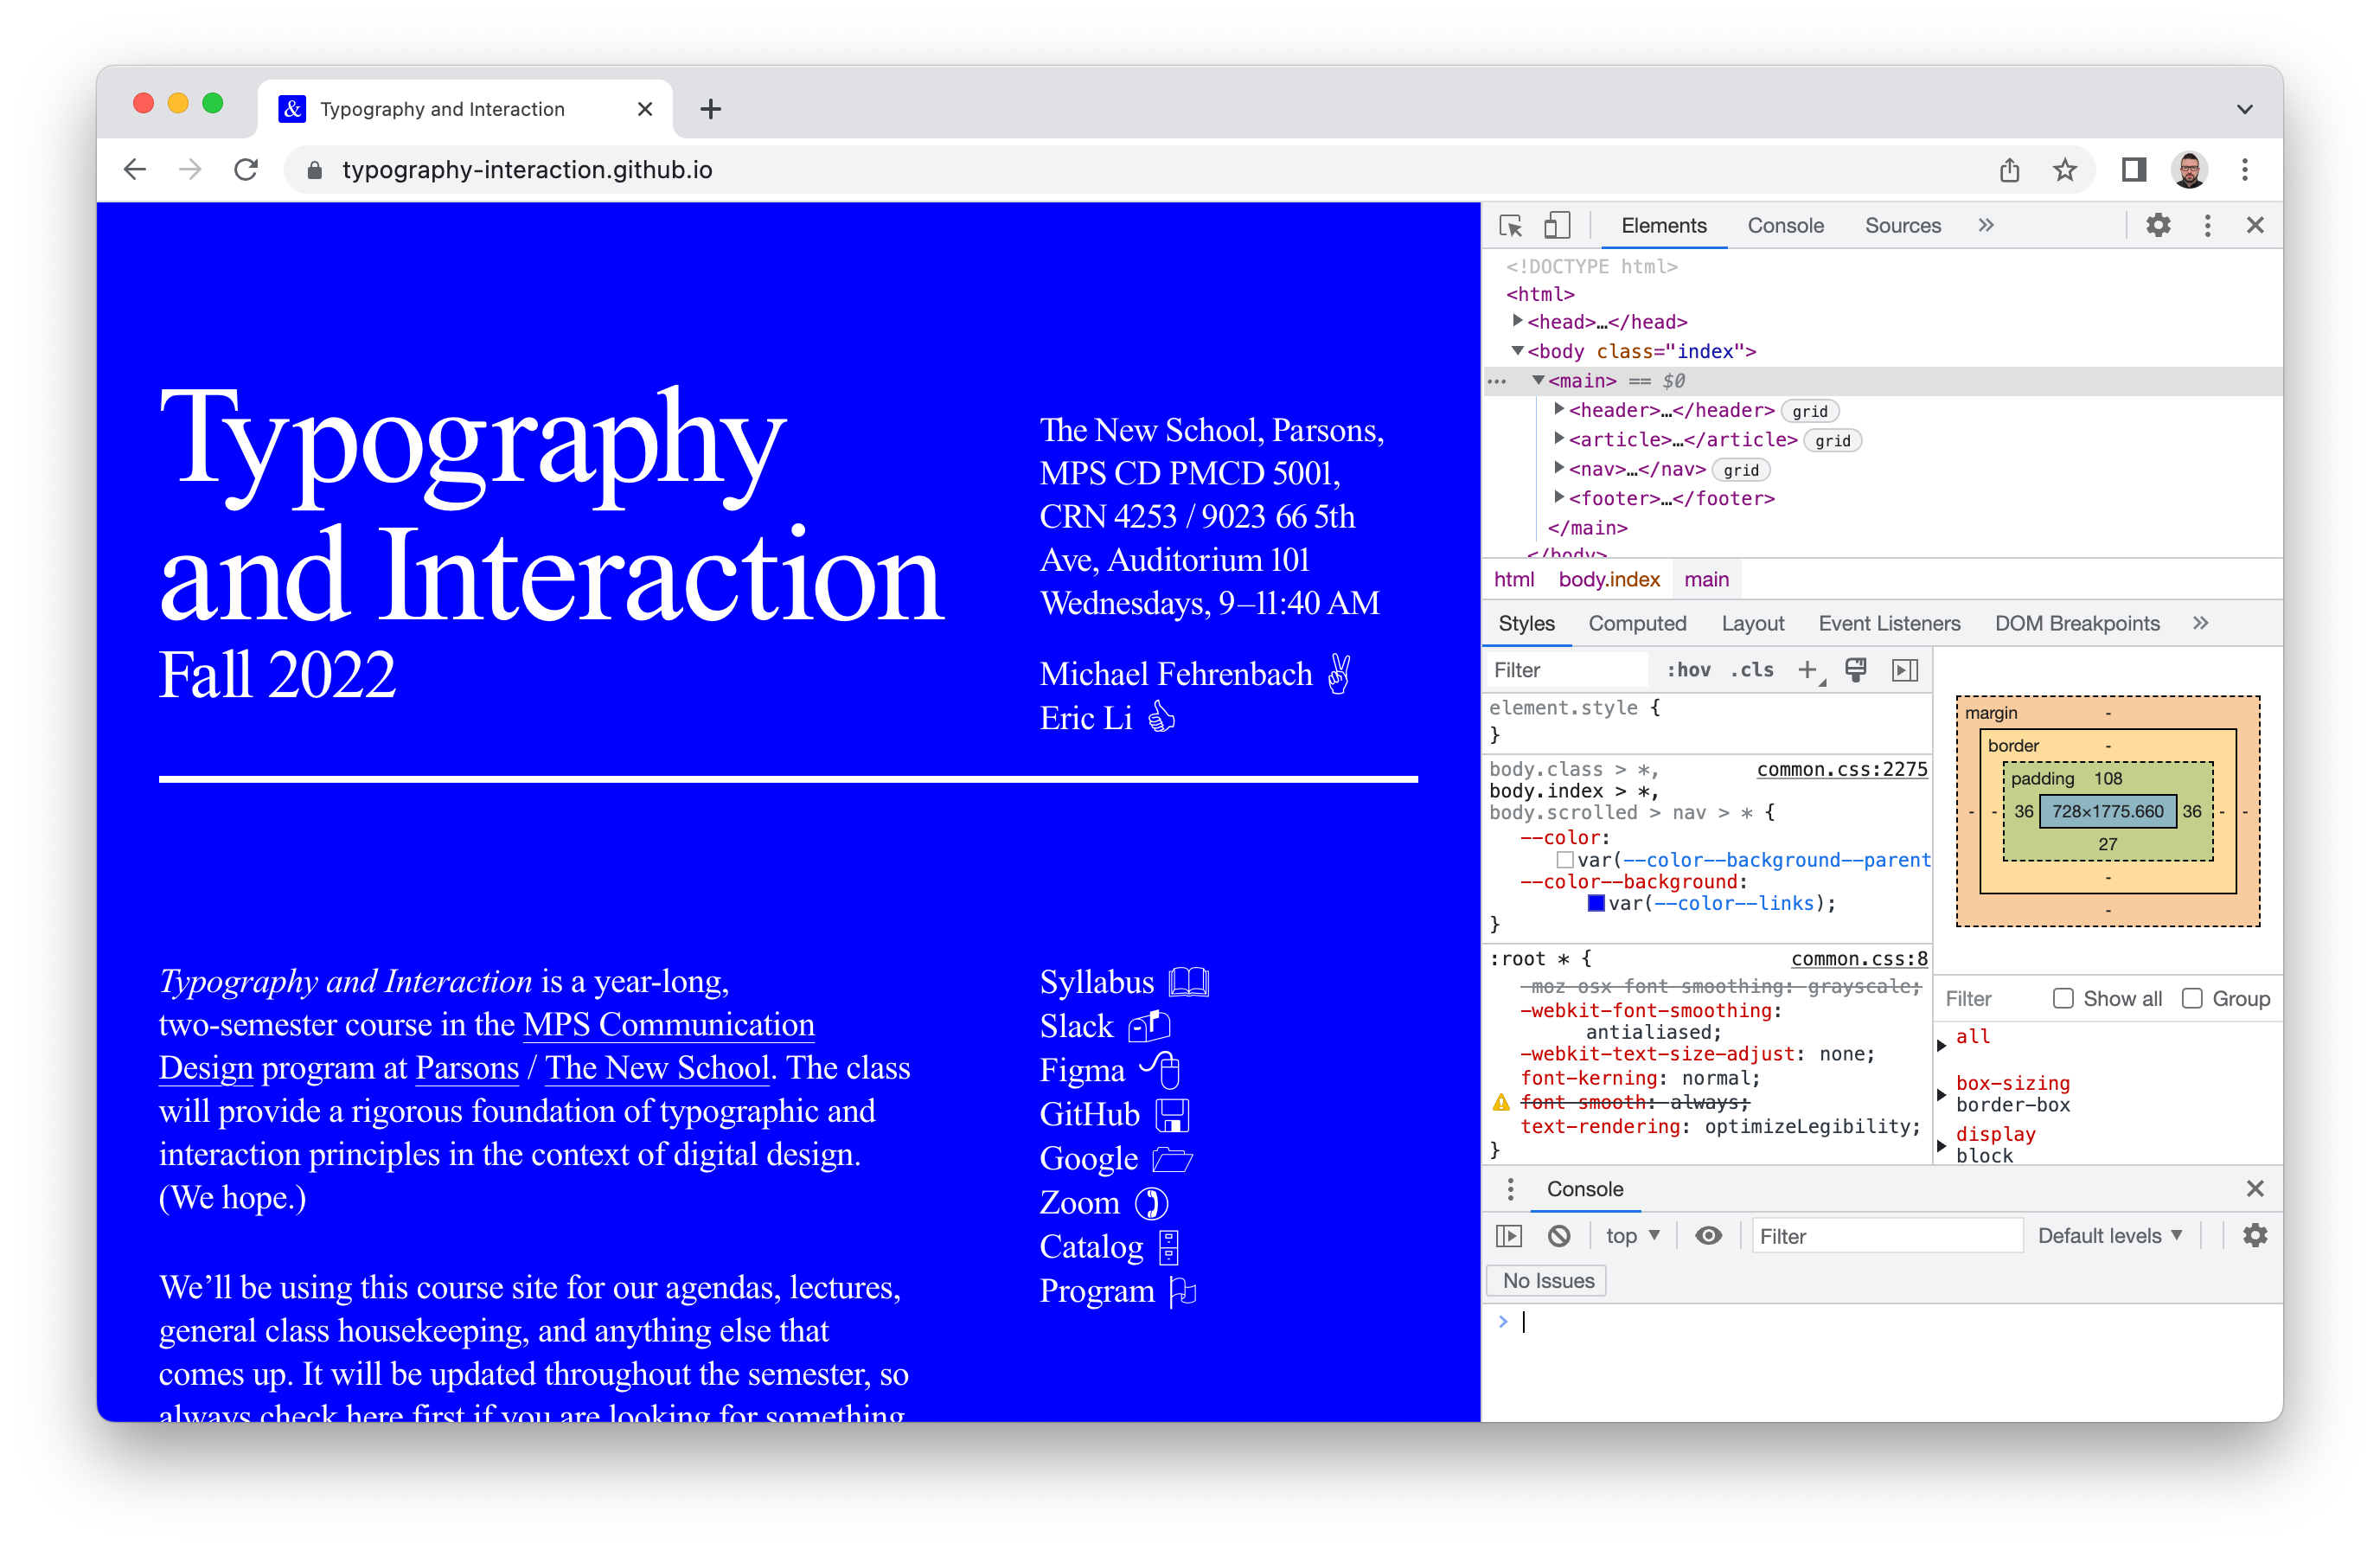
You’ll see the tools on the right side of the page. Depending on how big your screen is, they might be laid out a bit differently—but the basics are the same:
You can also undock the tools out into a separate window—often easier on a laptop/

Elements panel
The top part of the tools is the DOM—you can expand/collapse all the nested HTML elements on the opened page.

The first button in the upper-left lets you mouse over on the page, and will then show you that element nested/
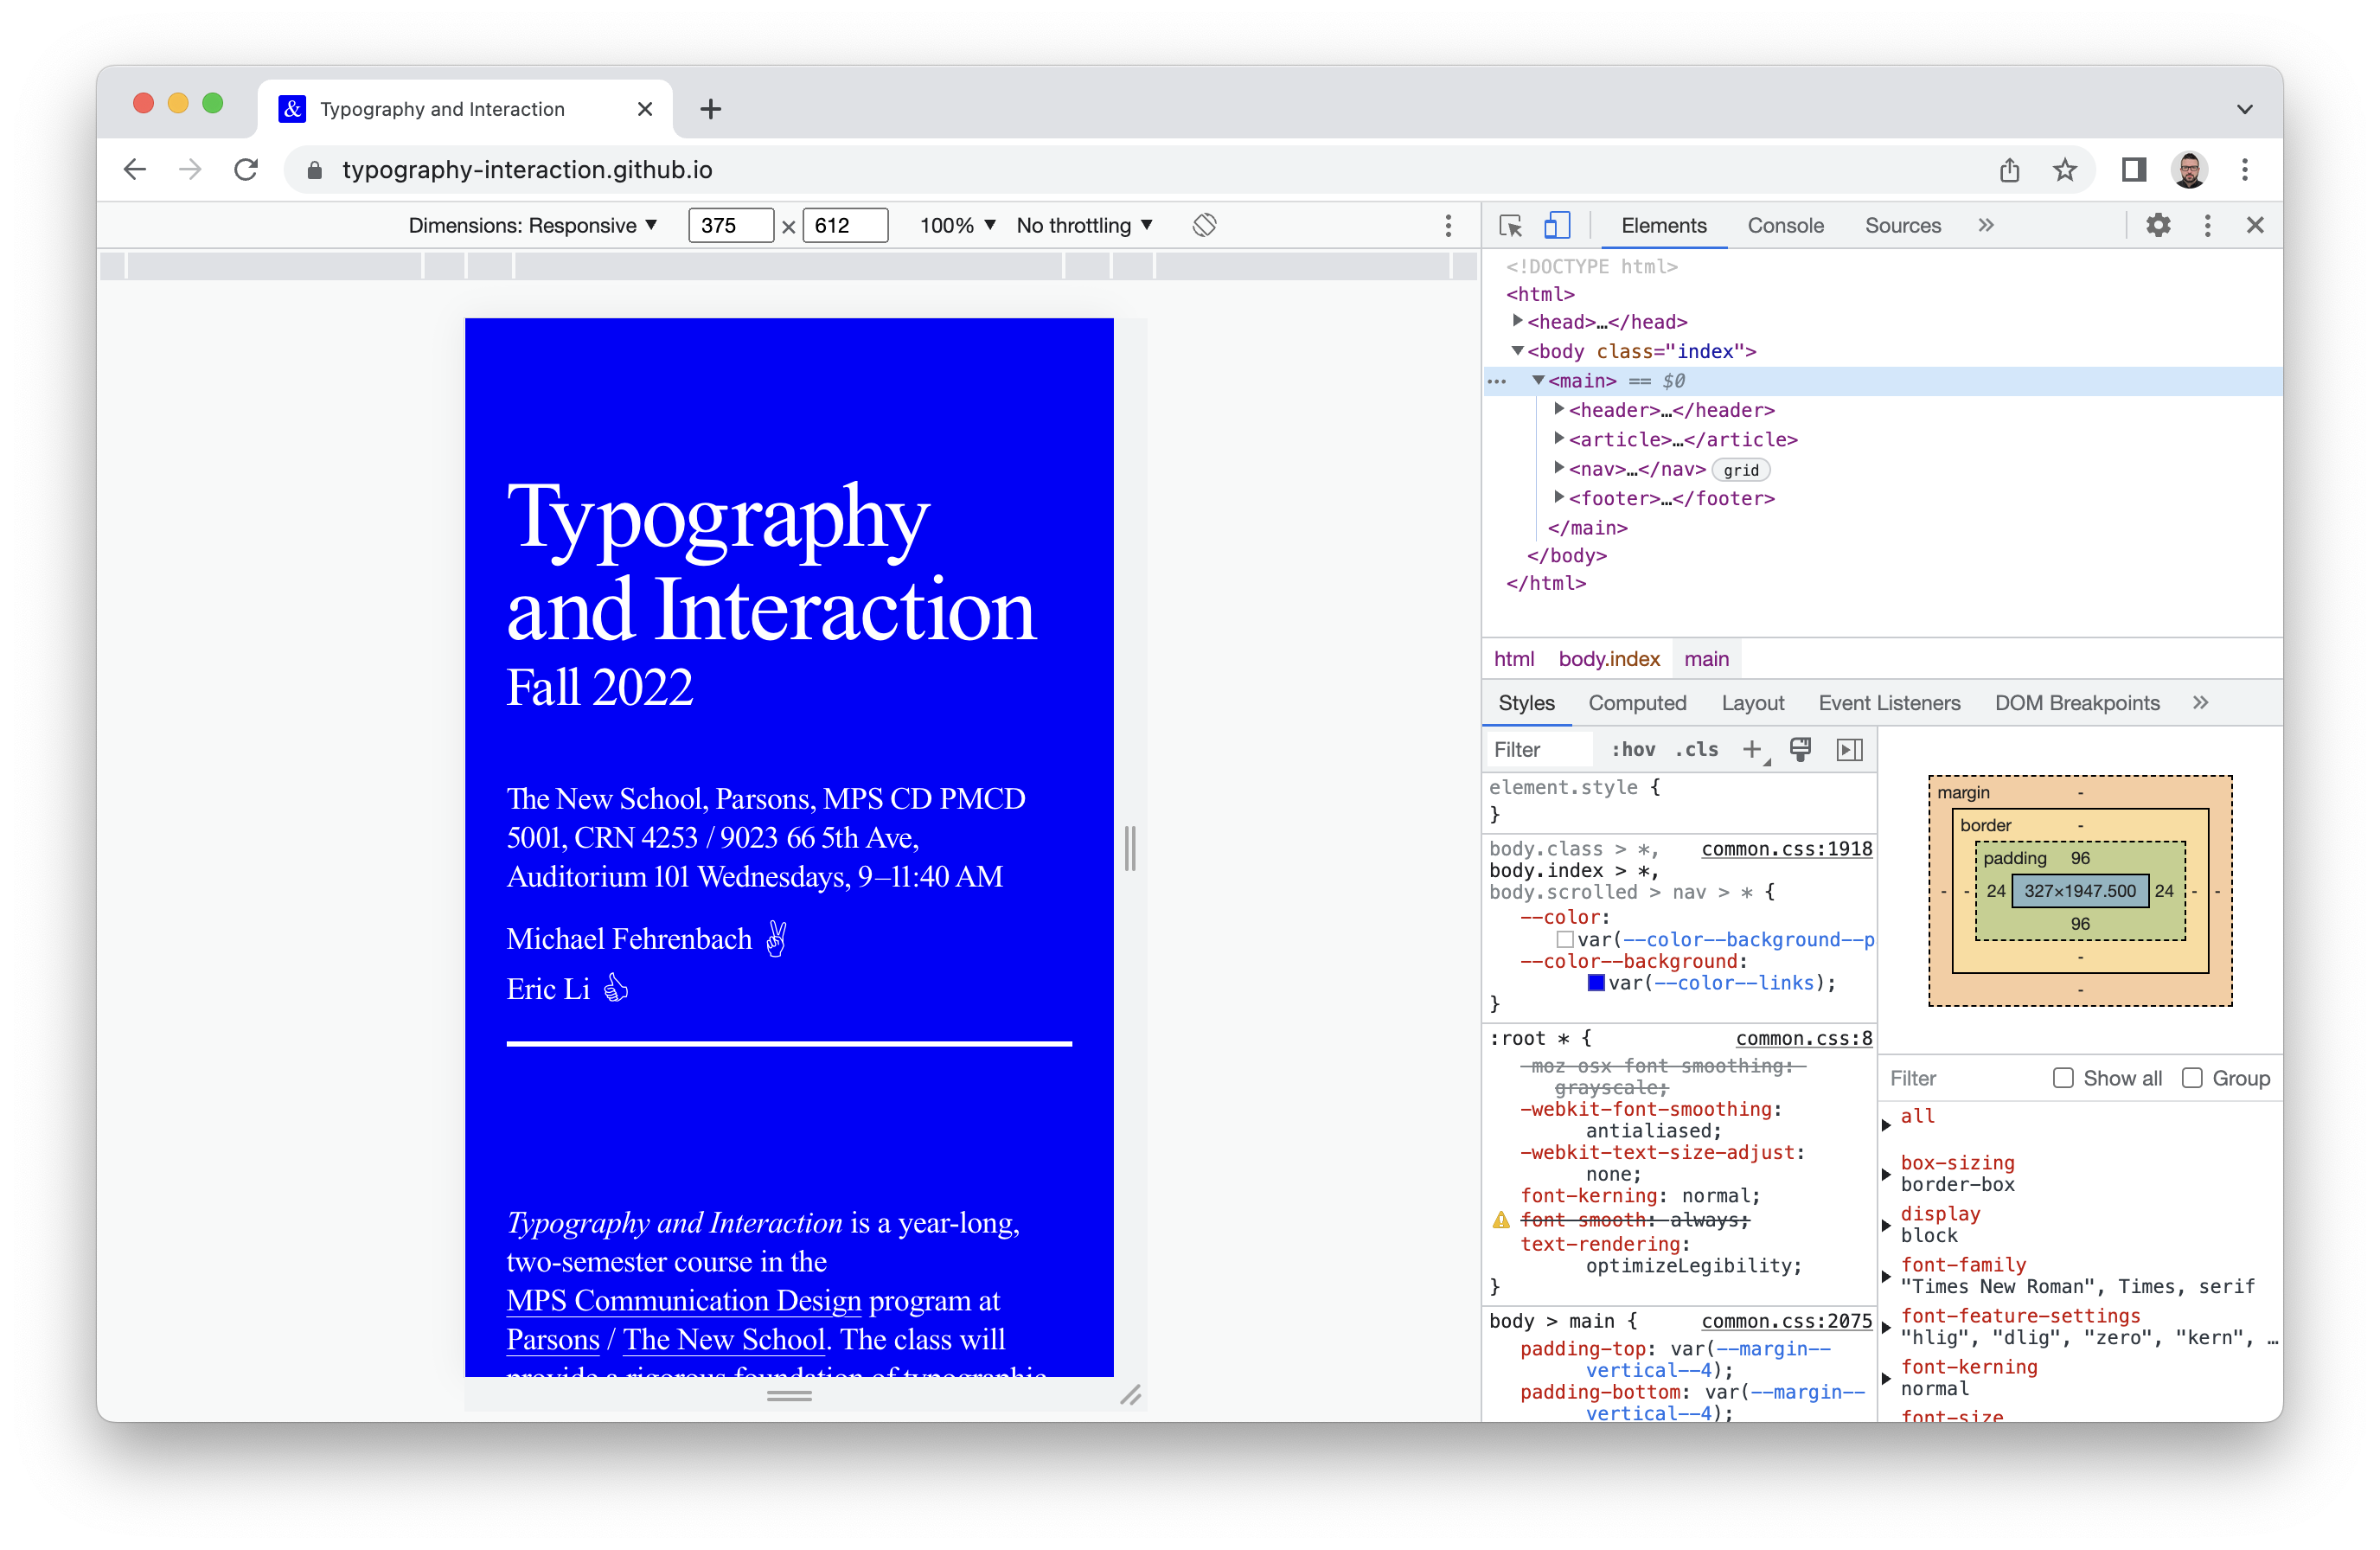
The second (more on this below) toggles the Device toolbar, “responsive mode.”
Handy tip: ⌘ F in here will let you search for elements or text by name/
Styles pane
The middle area is for the styles. It shows whatever CSS properties apply to the element you have selected above, in the DOM/elements panel.

These are ordered with the most-specific at the top, with any cascading/
On the right, you can see the sum Computed (or rendered) values of all the rules that apply—regardless of where they come from. These represent exactly what the browser is showing to you for the selected element.
In both areas, you can type specific CSS properties/values into the Filter box to quickly narrow things down.
You can make changes in the Elements or Styles areas, and the changes will be immediately visible on the page as if you had edited the source files. It’s useful to try things out quickly (or diagnose problems/
Keep in mind these changes are temporary—any edits in the DevTools will be lost when you leave or reload the page! They are just for you.
Device mode
First open the inspector, as above. Enter device mode with the little phone/tablet icon, in the upper left of the DevTools:

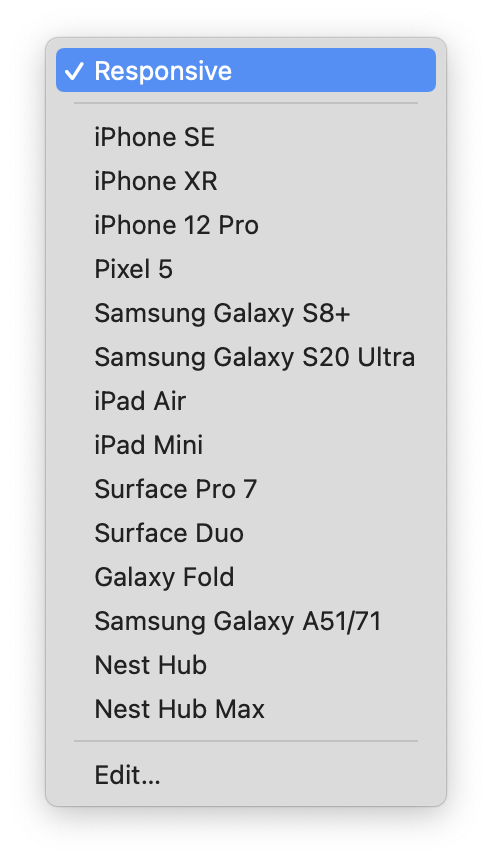
Always check your work on the real thing, as much as possible!
This is just a quicker preview, but isn’t always perfectly accurate—and also won’t reflect any device-specific behaviors around scrolling or rotating. (We’re looking at you, iOS Safari.)
The Console
The console is used to help you work with JavaScript, by logging messages (and any errors) from your code as it runs.
If your tools are already open, you can show the console (as a drawer) in Options ellipses, or as a whole panel to the right of Elements.
On the Mac, Hit ⌘ ⌥ J (command-option-J) to go right there!
This area will show any messages logged from your JavaScript with console.log().
Warnings and errors (like missing files, or bad JS syntax) will also be shown here in yellow and red, respectively—usually with clickable line-numbers to the right, to take you right to the problem. You can clear the buffer (what is showing) with the little crossed circle.
You can also evaluate JavaScript here directly, by typing (with some nice auto-completion) into the bottom of the console—like console.log('Hello, world!'). You can use this to test out parts of your code immediately, like with document.querySelector('main'). If it returns (shows) your element in response, your selector is working!